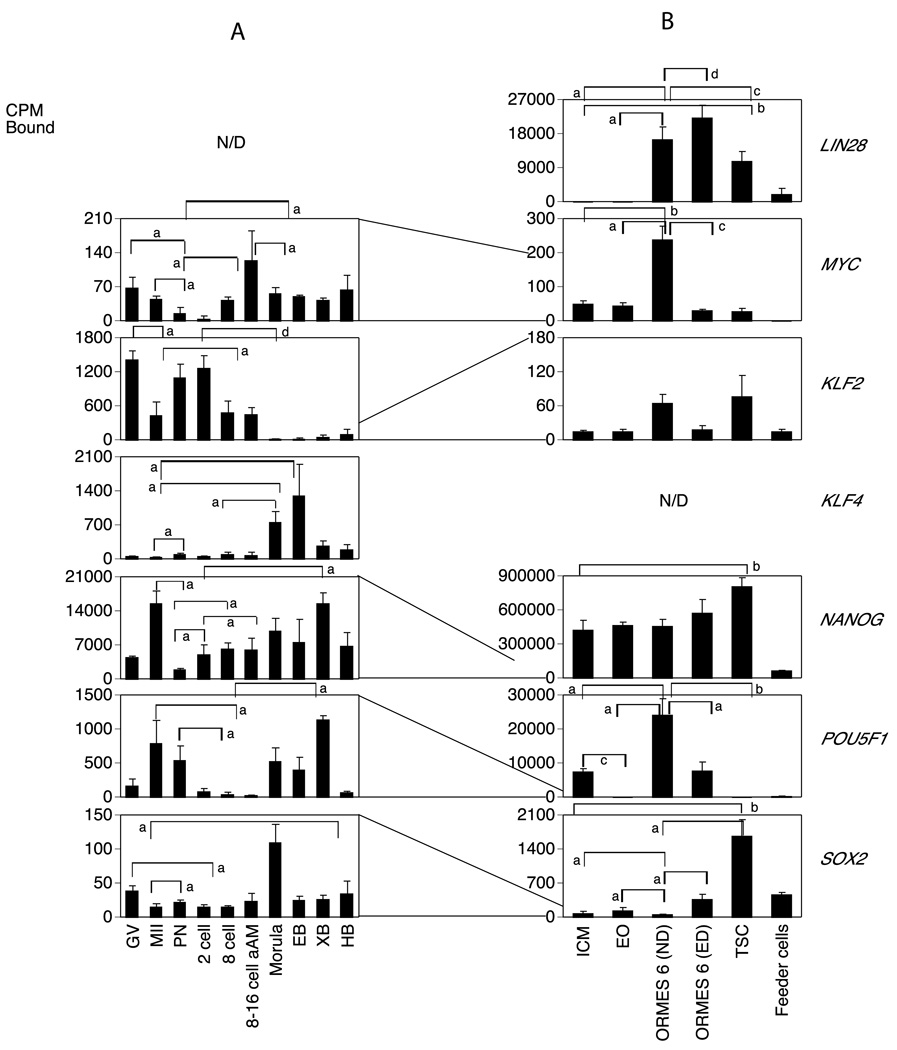
Figure 3.
Temporal expression patterns of genes involved in inducing pluripotency in rhesus monkey oocytes, embryos and different stem cell lines.
A. Monkey graph show the relative levels of expression for GV and MII stage oocytes and pronucleate through hatched blastocyst-stage embryos produced by in vitro fertilization of oocytes from human chorionic gonadotropin (hCG)-stimulated females and then cultured in vitro in HECM9. GV, germinal vesicle stage oocyte; MII, metaphase II stage oocyte; PN, pronucleate 1-cell stage embryo; 2C, 2-cell stage embryo; 8C, 8-cell stage embryo; 8–16C aAm, 8- to 16-cell stage cultured in α-amanitin; EB, early blastocyst; XB, expanded blastocyst; HB, hatched blastocyst. Statistically significant differences in gene expression corresponding to some of the major increases or decreases in expression are denoted by the brackets for comparisons between stages at the ends of the brackets. Letters a–d indicate P <0.05, 0.01, 0.001 and 0.0001, respectively. N/D indicates not detected. Expression data for the mRNAs encoding the indicated proteins are expressed as the mean cpm bound and the SE is indicated..
B. Expression patterns of stem cell transition. ICM, Inner Cell Mass; EO, early outgrowth; ND, non differentiated ORMES 6 (Oregon Rhesus Macaque Embryonic Stem); ED, Early differentiation; Feeder cells from mouse fibroblast. Data are presented as the mean cpm bound and the SE is indicated. Statistically significant differences in gene expression corresponding to some of the major increases or decreases in expression are denoted by the brackets for comparisons between stages at the ends of the brackets. Letters a–d indicate P <0.05, 0.01, 0.001 and 0.0001, respectively. N/D indicates not detected. The lines drawn between graphs shows how the mRNA levels were reduced or increased between embryos and the transition to stem cells.

