
Fig. 15.
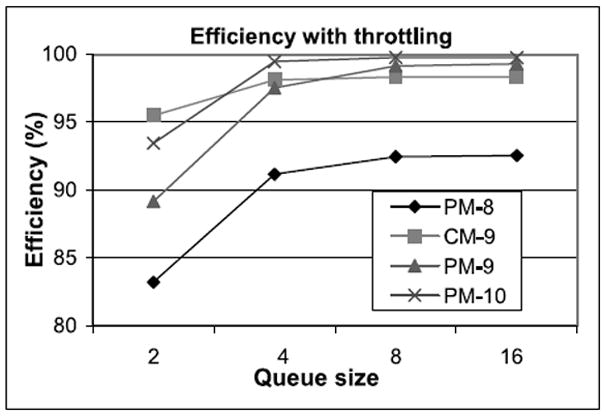
Graph shows the effect of queue size on utilization for various numbers of filters (queues) and mappings of particles onto filters. PM is particle mapped, CM is cell mapped.
Official websites use .gov
A
.gov website belongs to an official
government organization in the United States.
Secure .gov websites use HTTPS
A lock (
) or https:// means you've safely
connected to the .gov website. Share sensitive
information only on official, secure websites.
Graph shows the effect of queue size on utilization for various numbers of filters (queues) and mappings of particles onto filters. PM is particle mapped, CM is cell mapped.