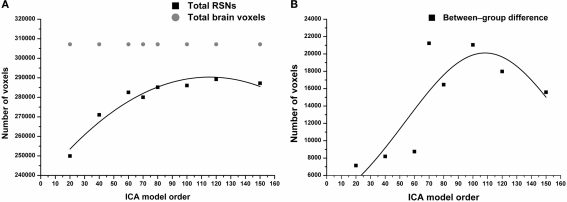
Figure 1.
(A) RSNs total volume significantly increases as function of ICA model order reaching model order 60. Notably, higher model orders 60–150 showed relatively stable total volume. In gray, the total number of brain voxels used in the ICA analysis. (B) Total volume of between-group differences (see Figures 3, 4, green color) shows a non-linear increase in volume as a function of model order with volume maxima at model order of 70.

