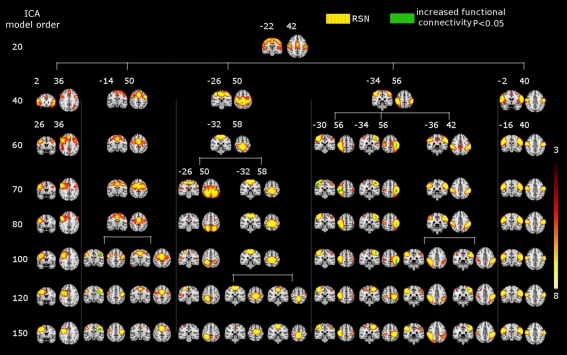
Figure 3.
SAD significant increased functional connectivity (green) in the motor cortex at different ICA model orders (20, 40, 60, 70, 80, 100, 120, and 150) shown superimposed on MNI template. One RSN (red–yellow) involving both the motor cortices and the auditory cortex as well at the low model order of 20. At higher model orders this large-scale RSN splits into smaller fine-grained sub-networks. Notably, some of these networks still show significant increased connectivity, while others do not. Numbers at the bottom of the images refer to MNI coordinates (xyz). The left hemisphere corresponds to the right side and t-score threshold is shown at the right.

