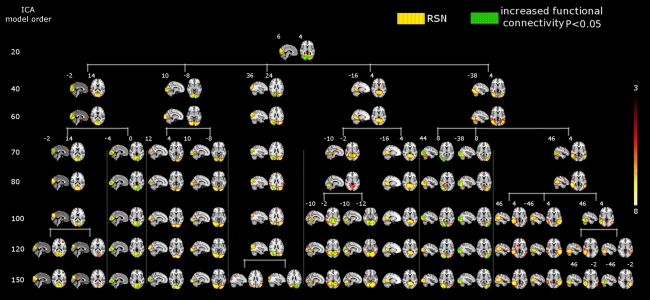
Figure 4.
SAD significant increased functional connectivity (green) in the visual cortex at different ICA model orders (20, 40, 60, 70, 80, 100, 120, and 150) shown superimposed on MNI template. While at low model order of 20 the visual cortex was segmented into one RSN (red–yellow) which also showed a significant increased connectivity, higher model orders provided a more fine-grained segmentation. A prominent increase in the number of sub-networks (red–yellow) with significant increased connectivity is evident at higher model orders. Numbers at the bottom of the images refer to MNI coordinates (xyz). The left hemisphere corresponds to the right side and t-score threshold is shown at the right.

