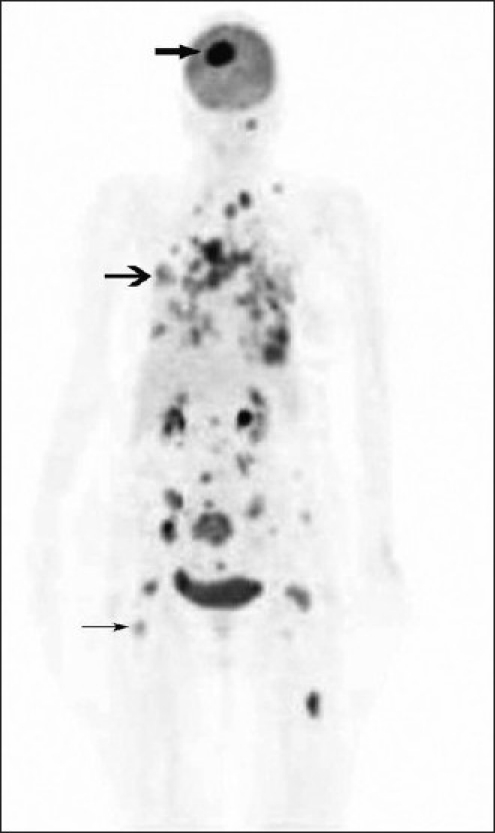
Figure 3.

F18-FDG PET CT study: Maximum intensity projection image shows FDG-avid lesions in the brain ( ), lungs (
 ), mediastinal-retroperitoneal lymph nodes, and skeleton (→)

F18-FDG PET CT study: Maximum intensity projection image shows FDG-avid lesions in the brain ( ), lungs (
 ), mediastinal-retroperitoneal lymph nodes, and skeleton (→)