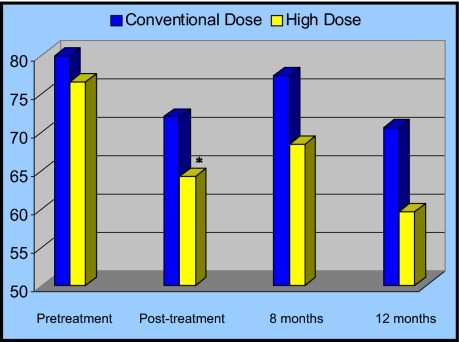
Figure 3.
Mean total quality of life (QoL) scores by treatment arm. The y-axis represents mean total QoL scores. Conventional dose (CD) represents the 50.4 Gy arm; high dose (HD) represents the 64.8 Gy arm. At the completion of CRT (posttreatment), total QoL was significantly worse in the HD arm as compared to the CD arm (*P = .02). These significant differences were resolved by 8 months following treatment. *P values significant at the .05 level.

