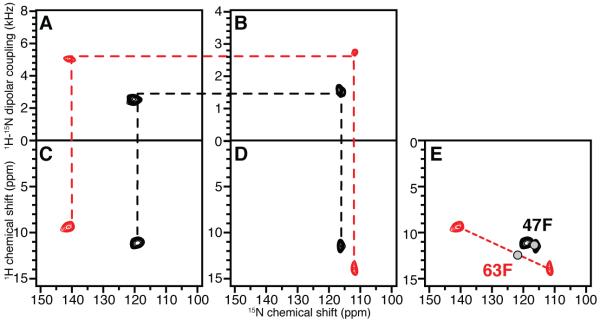
Figure 2.
Example of resonance assignments using experimental data from 15N-Phe-labeled MerE in magnetically aligned bilayers. A. and B. SLF spectra. C. and D. HETCOR spectra. A. and C. Sample with the bilayer normals parallel to the magnetic field. B. and D. Sample with the bilayer normals perpendicular to the magnetic field. The two resonances (red and black) observed in the experimental spectra are correlated by the dashed lines across the four spectra. E. The red and black dots represent the isotropic chemical shifts of the two residues calculated from the experimental solid-state NMR spectra in A. – D.. The two gray “dots” represent the resonance frequencies observed in an experimental two-dimensional HSQC solution NMR spectrum.

