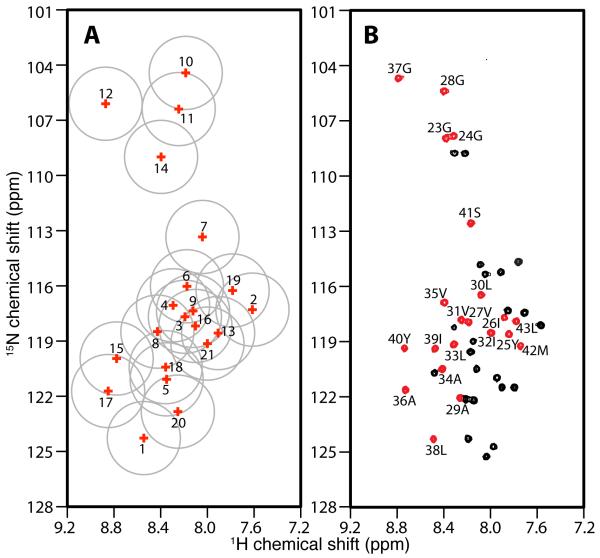
Figure 6.
Spectral representations of the correlation of isotropic 15N and 1H chemical shifts. A. Solid-state NMR data obtained from samples of Pf1 coat protein in magnetically aligned bilayers. B. Solution NMR data obtained from samples of Pf1 coat protein in isotropic bicelles (q=0.3). A. The isotropic chemical shifts of all 21 peaks in the helical wheel region are calculated and labeled with their peak numbers based on the magnitudes of their heteronuclear dipolar couplings. The grey circles indicate the estimated uncertainty in their positions. B. An experimental two-dimensional HSQC spectrum. The peaks colored in red are from residues in the trans-membrane helical region of the protein. The resonances assignments are marked.

