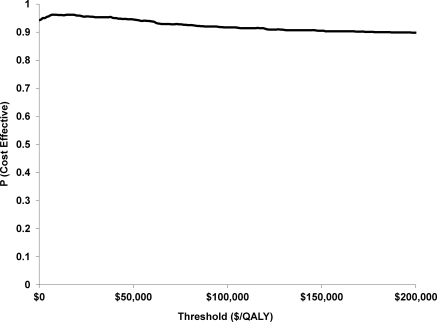
Figure 3.
Cost-effectiveness acceptability curve: Probability of the intervention being cost-effective relative to the control group at different society willingness to pay thresholds: $/QALY. Disease-specific costs. The probability of being cost-effective on the vertical access incorporates the uncertainty of being cost-effective given the patient level observations from the study. At $10,000/QALY the percentage is 0.961, at $50,000/QALY it is 0.945, and at $100,000/QALY it is 0.917. This implies, if you are willing to pay $10,000 more for the intervention, then there is a 96.1% of an improvement in 1 QALY. At $0 willingness to pay for a QALY outcome (i.e., horizontal line at the origin in Figure 2), there is a greater than 90% chance that improvements in quality of life will have occurred. Abbreviation: QALYs, quality-adjusted life years.

