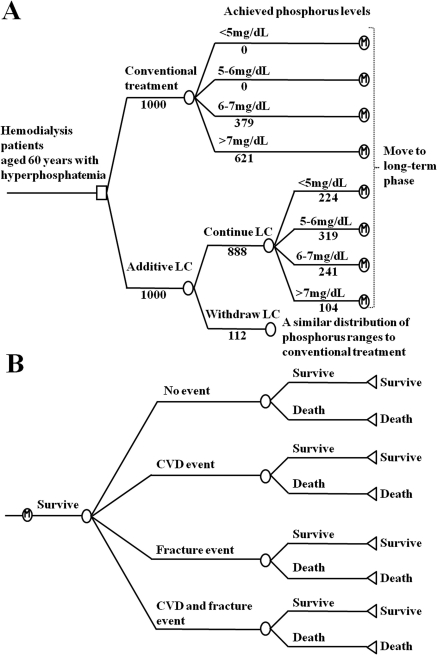
Figure 1.
Structure of state transition model. (A) Short-term phase representing 16 weeks of initial therapy. Patients receive either additional LC or conventional treatment and are distributed in each phosphorus range (<5, 5 to <6, 6 to <7, and ≥7 mg/dl). Patient numbers are shown for the base case. (B) Long-term phase representing clinical course after initial therapy. Each patient experiences one of the following clinical events: “no event,” “CVD event,” “fracture event,” and “CVD and fracture event.” Risks for CVD, fracture, and death are estimated from their age, achieved phosphorus levels, and history of experienced events. Patients who survived repeat the cycle until their death.

