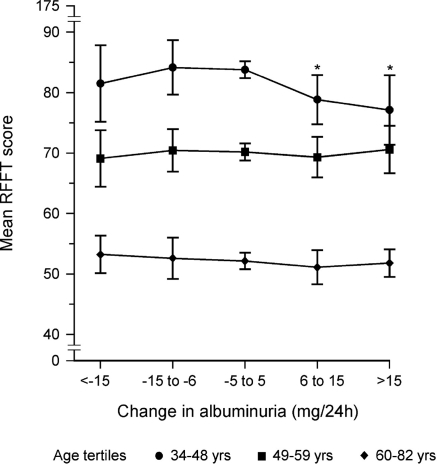
Figure 3.
Mean RFFT score and its relationship with the change in albuminuria (mg/24 h) between baseline (1997 to 1998) and the third survey (2000 to 2003) in subjects subdivided into tertiles of age. Adjusted RFFT scores were calculated by ANCOVA and adjusted for eGFR, age, sex, educational level, diabetes, hypertension, history of cardiovascular disease, body mass index, alcohol use, cholesterol, and smoking. Bars represent the 95% CIs of the mean RFFT score. *P < 0.05.

