Figure 2.

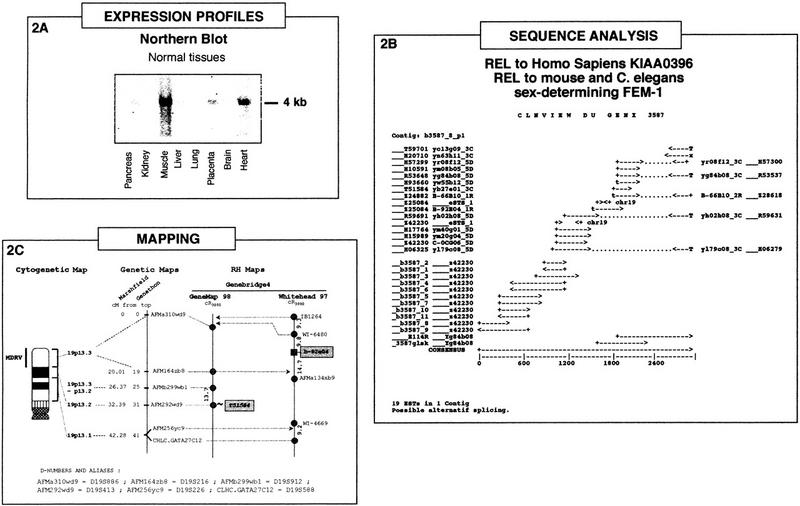
The GENX-3587 transcript: Integration of expression profile, sequence analysis, and mapping data. (A) Northern blot analysis. Multiple-tissue Northern blot containing the following adult tissues: (lane 1) pancreas; (lane 2) kidney; (lane 3) skeletal muscle; (lane 4) liver; (lane 5) lung; (lane 6) placenta; (lane 7) brain; (lane 8) heart, hybridized with a probe corresponding to the insert from a cDNA clone of the GENX-3587 cluster. Approximate size of the transcript (kb) is indicated at right. (B) The GENX-3587 cluster. GenBank sequence accession numbers and clone names are indicated. Polyadenylation sites are represented by T if both a polyadenylation signal and a poly(T) tail are present at the 5′ end of the sequence and by x if only the polyadenylation signal is present at the 5′ end of the sequence. (C) Localization of the GENX-3587 gene in the integrated genome maps. The cytogenetic map presented is based on GenAtlas data. The genetic map is displayed with a scale in cM from the top of the chromosome according to the Généthon and Marshfield maps (data from Genome Database). The distances between markers of the RH maps are indicated in cR3000. The marker names are shadowed for results obtained in this study and italicized for results obtained in silicio from a RH server (T51854). The microsatellite and other framework markers are represented as circles, whereas the GENX-3587 marker b-92e04 is shown as a square and was assigned on the Whitehead map with a significant (>3) lod score. Results obtained from the RH server are presented as a link (∼) to a framework marker in GeneMap'98.
