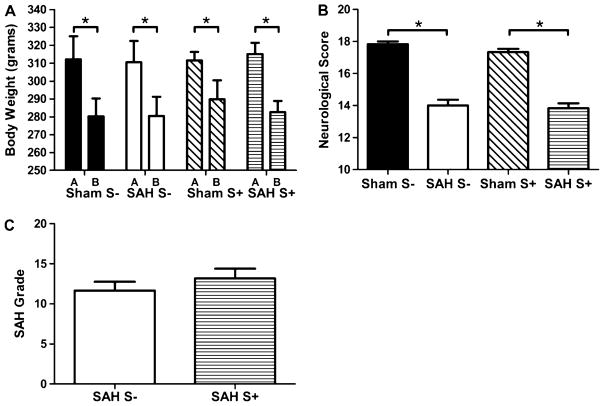
Fig. 1.
Body weight (a), neurological score (b), and SAH grade (c). *P<0.05. a There was a statistically significant body weight loss after surgery (b) compared with the body weight before surgery (a) in all groups (p<0.05). There was no significant difference between groups in body weight, before surgery, nor in the body weight loss after surgery (p=NS). b There was a significant neurological deficit in SAH animals compared with Sham animals (p<0.05). The differences between Sham and SAH animals were comparable between S+ and S− groups. c There was no significant difference in SAH grade between SAH S+ and SAH S− animals (p=NS)

