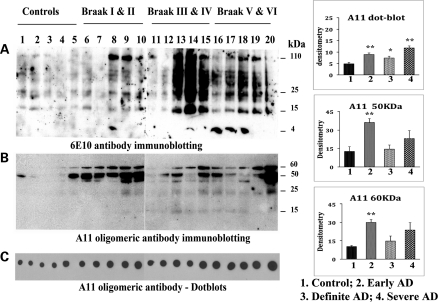
Figure 2.
Immunoblotting analysis of Aβ monomers and oligomeric proteins in early, definite and severe AD patients. (A) Immunoblot using 6E10 antibody. Intensity of monomeric and oligomeric Aβ increased in definite and severe AD patients, indicating that Aβ formation and production are dependent on disease progression. Two distinct bands of oligomers (50 and 60 kDa) were found, in addition to two faint bands (25 and 15 kDa; B). Both the 50 kDa (P< 0.001) and the 60 kDa oligomeric Aβ (P< 0.005) were significantly increased in the brains of AD patients at Braak stages I and II relative to the control subjects. (C) Dotblot analysis. (D) Quantification of oligomeric Aβ. *Statistical significance at P< 0.05; **statistical significance at P< 0.005.

