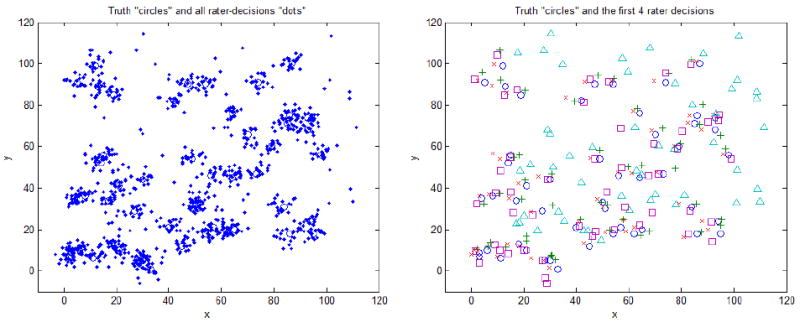
Figure 1.

Simulated truth (circles) and rater decisions (dots) on the left and four of the raters' decisions denoted by different symbols (+, square, triangle, x). There are 50 points and 20 raters simulated. The “triangle rater” (No.3 below) has a large bias. Therefore his decision pattern is shifted toward the upper right corner.
