
Figure 2.
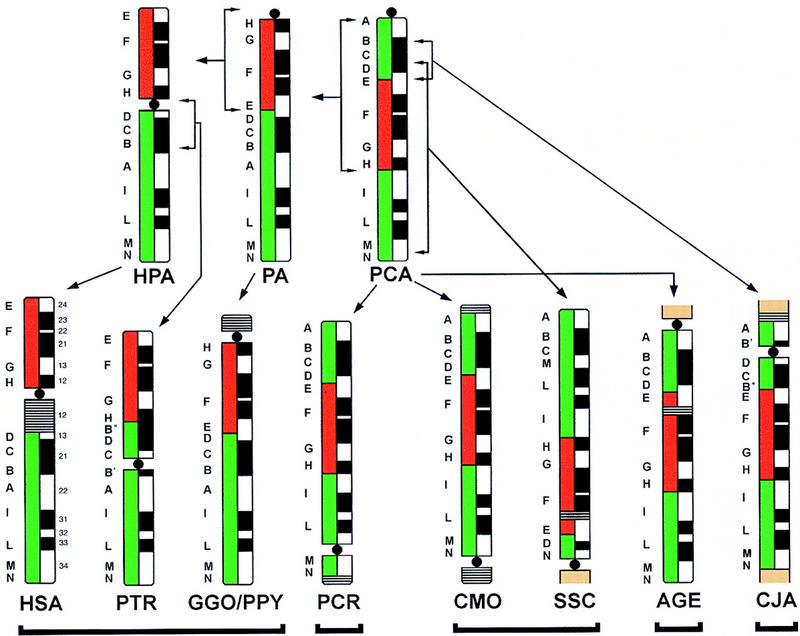
The diagram schematically summarizes the results obtained by hybridizing the 12 markers on each species under study. GGO and PPY turned out to be identical and have been grouped together. Regions homologous to the human 9p (red) and 9q (green) are shown on the left of each ideogram, indicating the G-banding pattern (right). The cytogenetic material not detailed from different chromosome(s) present in AGE, SSC, and CJA is in brown. Close horizontal lines indicate heterochromatin blocks. The hypothesized pericentric or paracentirc inversions are indicated by square parentheses spanning the inverted cytogenetic segment. The split signals of marker B (YAC 945F5) are indicated as B′ and B′′. In both cases, signal of B′′ is much stronger than that of B′ (see text and Fig. 1e).