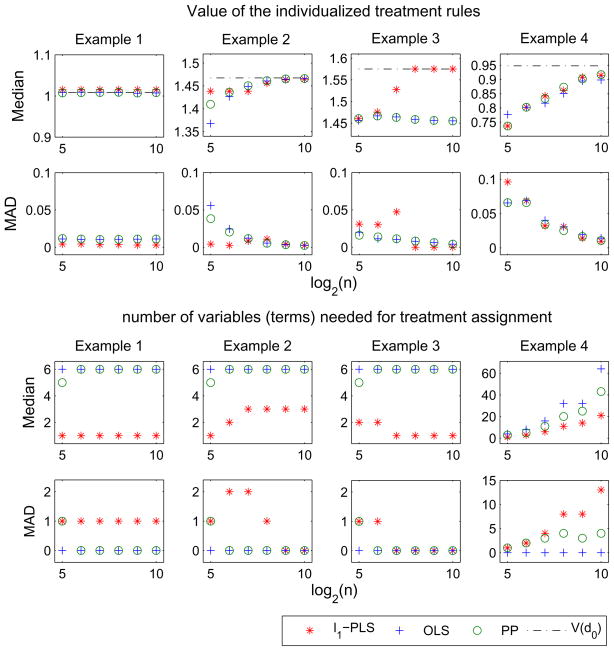
Fig 2.
Comparison of the l1-PLS based method with the OLS method and the PP method (examples 1 – 4): Plots for medians and median absolute deviations (MAD) of the Value of the estimated decision rules (top panels) and the number of variables (terms) needed for treatment assignment (including the main treatment effect term, bottom panels) over 1000 samples versus sample size on the log scale. The black dash-dotted line in each plot on the first row denotes the Value of the optimal treatment rule, V (d0), for each example. (n = 32; 64; 128; 256; 512; 1024. The corresponding numbers of basis functions in example 4 are Jn = 8; 16; 32; 64; 64; 128).

