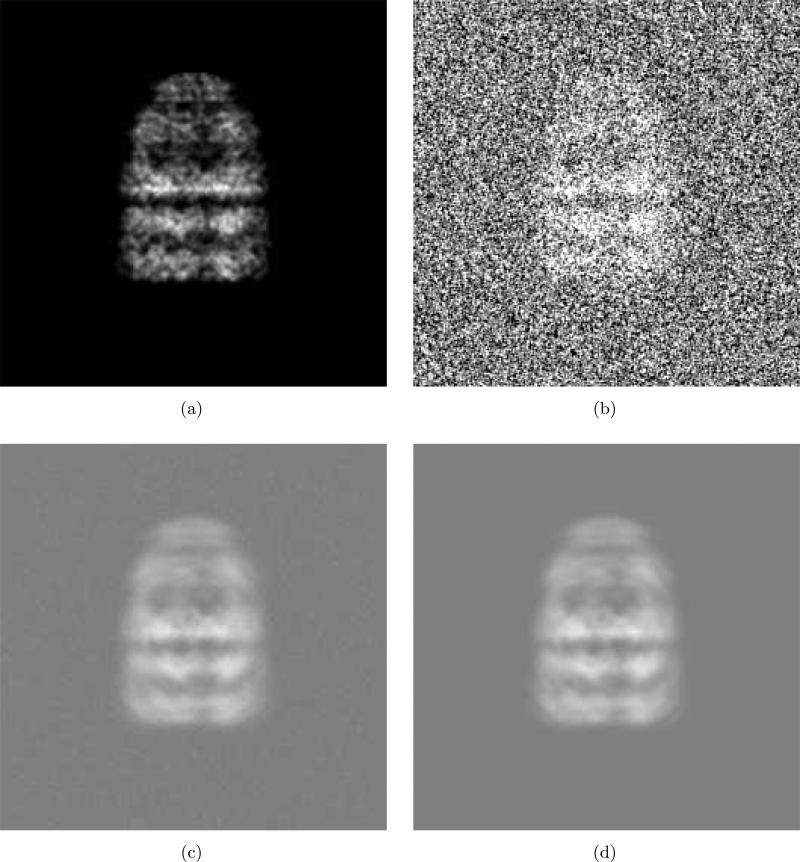
Figure 5.
Comparison of two blurred images. (a) Clear projection of GroEL/ES (PDB code:1AON). This is a projection of the small Gaussian functions (std=1.6Å) assigned at all Cα's. (b) Addition of Gaussian noise and (a). The SNR is 0.1914. The mean and standard deviation of the noise are 128 and 64, respectively. The correlation between adjacent noise samples is 0.3. (c) Class average obtained by averaging 1000 noisy images using the proposed alignment method. (d) Class average obtained by SE(2)-convolution in (4) of the clear image (a) and the blurring function in (32).

