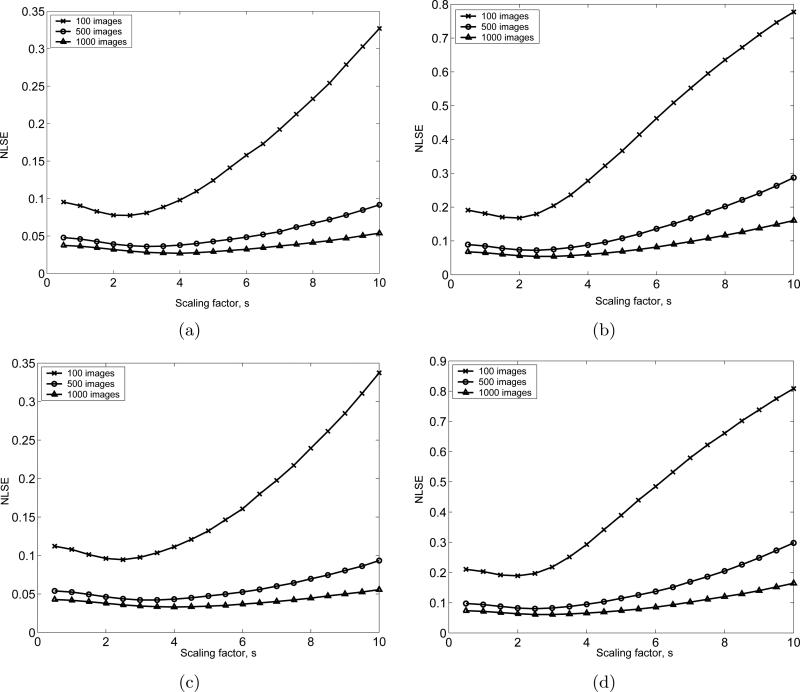
Figure 6.
NLSEs between the class average obtained by SE(2)-convolution and the class average after flattening the residual noise for the 4 cases defined in Table 1 with different numbers of images that are averaged. (a), (b), (c) and (d) are respectively the numerical test results for Case 1,2,3 and 4 defined in Table 1. For each case, 100, 500 and 1000 test images are used.

