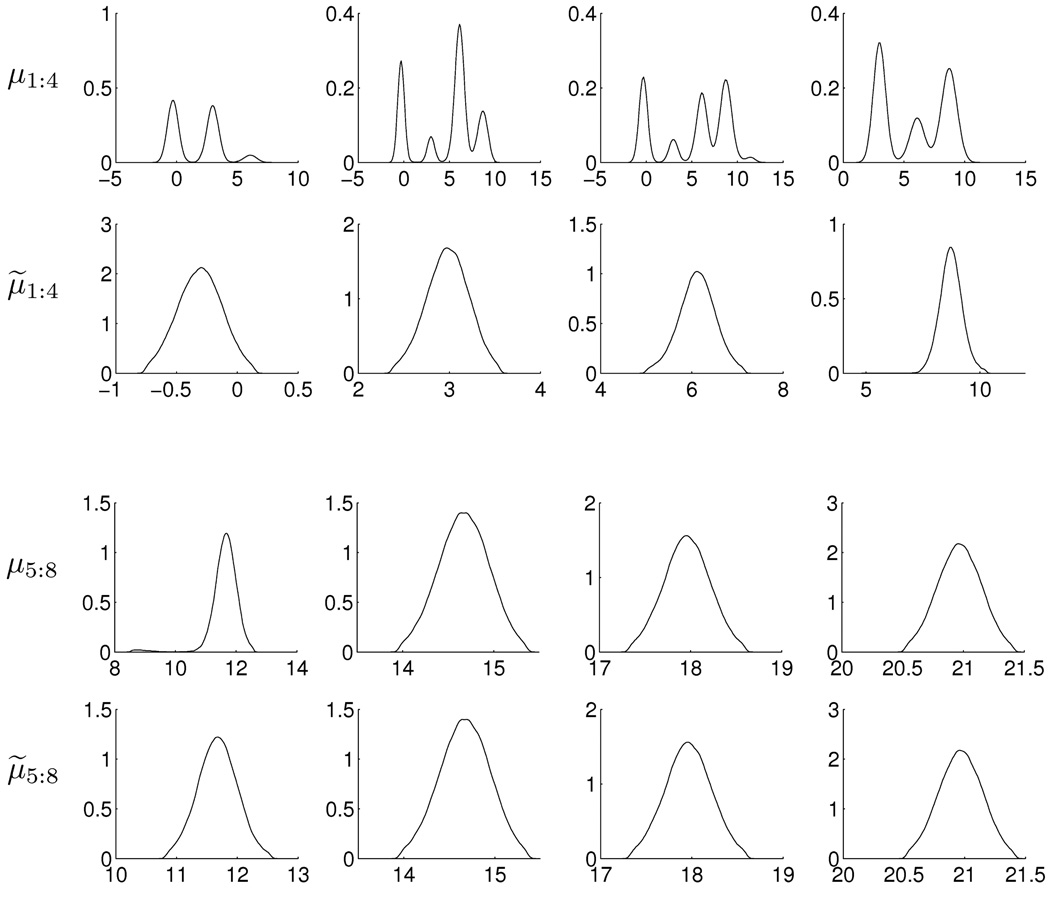
Figure 1.
Plots of estimated marginal posterior densities for the component mean in the 8–component univariate mixture, simulated data example. Plots for μ1:8 show results based on the raw MCMC samples, clearly and strongly evidencing the label switching issues via multimodal margins. Plots for μ̃1:8 show results under the relabeling strategy, resulting in unambiguous and accurate (since the ground-truth is known in this synthetic example) identification of posteriors.

