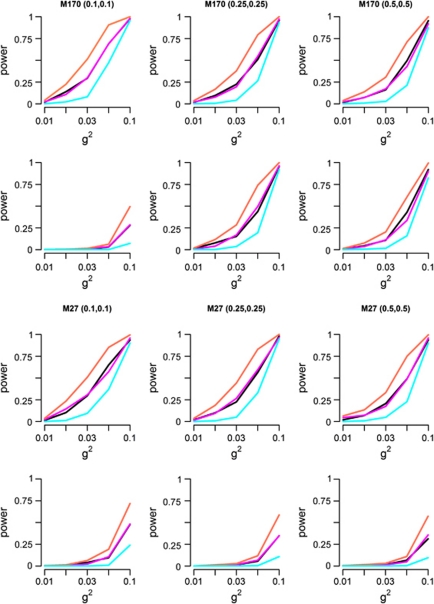
Figure 4.
Empirical power estimates of MB-MDR as the percentage of analyses where the correct interactions (SNP1 × SNP2) and/or (SNP3 × SNP4) are significant at the 5% level, in the presence of GH. First 2 rows: MB-MDR without and with main effects correction for model M170, respectively. Last 2 rows: MB-MDR without and with main effects correction for model M27, respectively. Main effects are corrected for via additive coding. Different definitions for power are adopted: power to identify both interacting pairs SNP1 × SNP2 and SNP3 × SNP4 (cyan); power to identify SNP1 × SNP2 (black); power to identify SNP3 × SNP4 (magenta), power to identify at least one of the interactive pairs (coral).

