
Figure 3.
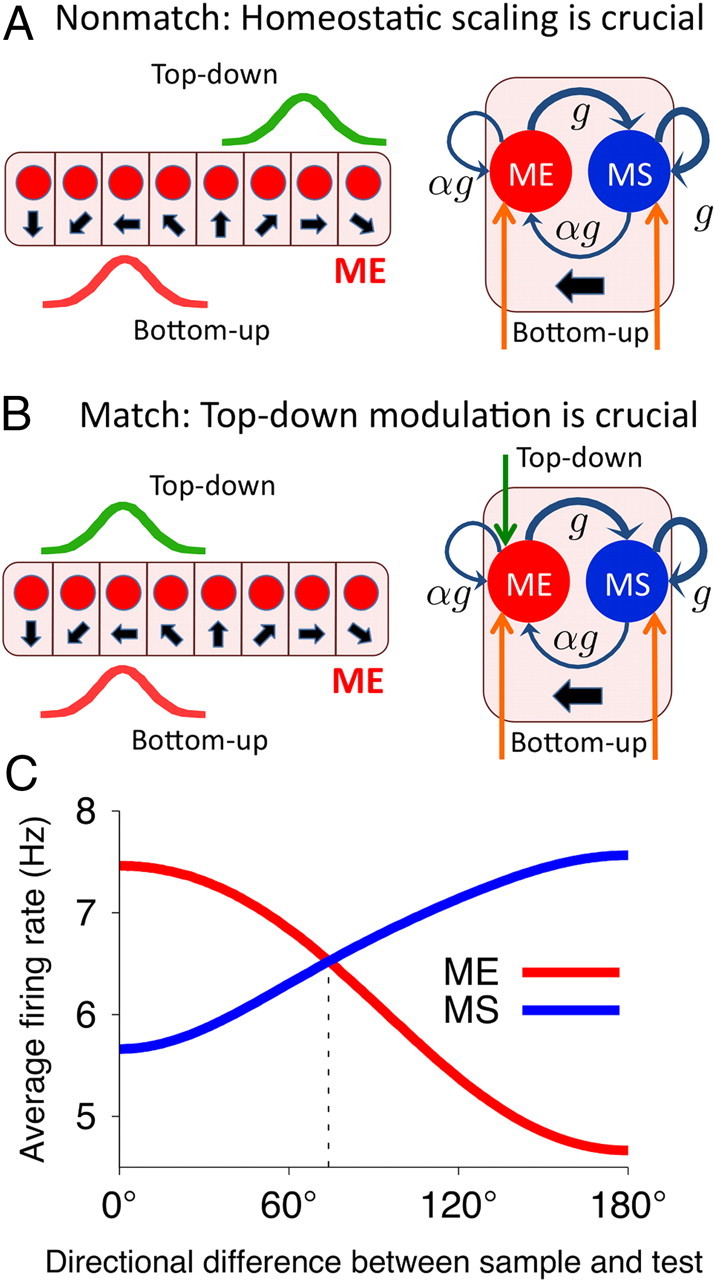
Circuit mechanism of match enhancement and suppression and neural tuning to the sample-test similarity. A, B, Left, Configuration of the top–down (green) and bottom–up (red) inputs to the ME population in the nonmatch (A) and match (B) conditions. Right, A column with the ME and MS neurons preferring the test stimulus is drawn. A, Nonmatch condition, The MS neuron has higher activity because of stronger recurrent excitation (thick blue arrows). B, Match condition, Top–down input compensates for weaker recurrent excitation, and the ME neuron has higher activity. C, Similarity tuning. Average population firing rate for the ME (red line) and MS (blue line) neurons as a function of directional difference between the sample and test. The ME and MS populations are parametrically tuned to the sample-test similarity in complementary ways.