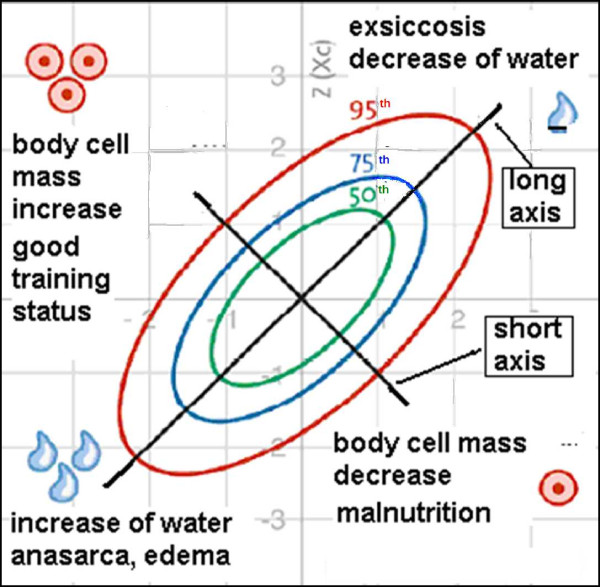
Figure 1.
Interpretation of the BIVA nomogram. Age, BMI and gender adjusted reference values are plotted as so-called tolerance ellipses in the coordinate system. Three tolerance ellipses are distinguished, corresponding to the 50th, 75th and 95th vector percentile of the healthy reference population. Values outside of the 95th percentile are considered abnormal. Values located above the long axis (/) indicate an increase in body cell mass (BCM), values below the long axis indicate a decrease in BCM. Values located above the short axis (\) indicate a loss of water and values below the short axis indicate increased water retention. Values located outside the 95th percentile in the following four quadrants point to the following conditions: a) right upper quadrant e.g. exsiccosis b) left lower quadrant e.g. oedema c) right lower quadrant e.g. malnutrition d) left upper quadrant e.g. good training status (modified with permission from Data-Input GmbH).

