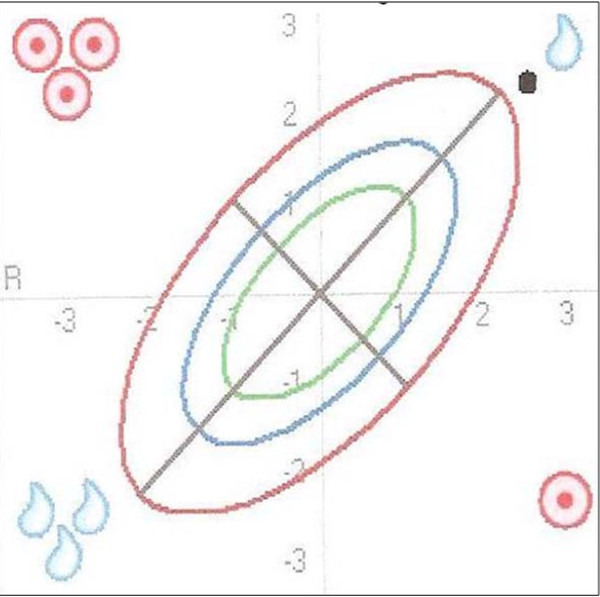
Figure 6.
Anorexia as illustrated in the BIVA nomogram. The position of the measurement point in the BIVA nomogram is almost on the line of normal BCM values (long axis) and far above the line of normal TBW values (short axis) outside the 95th tolerance ellipse. The position in the upper right quadrant points to the presence of anorexia.

