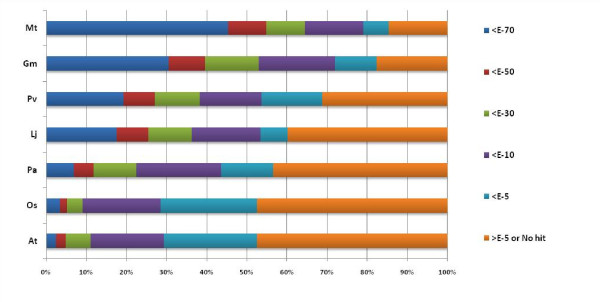
Figure 3.
Distribution of conservation between chickpea (Cicer arietinum) UG-TDS and the EST datasets of Mt (Medicago Truncatula), Gm (Glycine max), Pv (Phaseolus vulgaris), Lj (Lotus japonicus), Pa (Populus alba), Os (Oryza Sativa) and At (Arabidopsis thaliana). Unigenes were grouped according to similarity levels determined by nucleotide similarity search BLASTN E-value.

