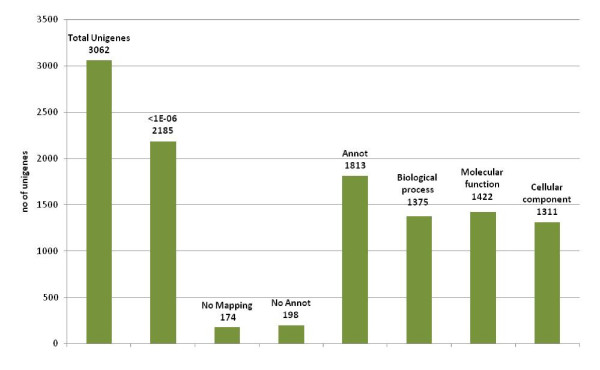
Figure 4.
A graphical representation of the annotation statistics of UG-TDS: the total number of unigenes annotated as a known protein with an E-value threshold of e-06, total number of unigens not mapped, total number of unigenes mapped but not annotated, the total number of unigene annotated with at least one category of Gene Ontology (GO) and the number of genes annotated in each of the 3 major GO categories, biological process, molecular function and cellular component.

