
Figure 4.
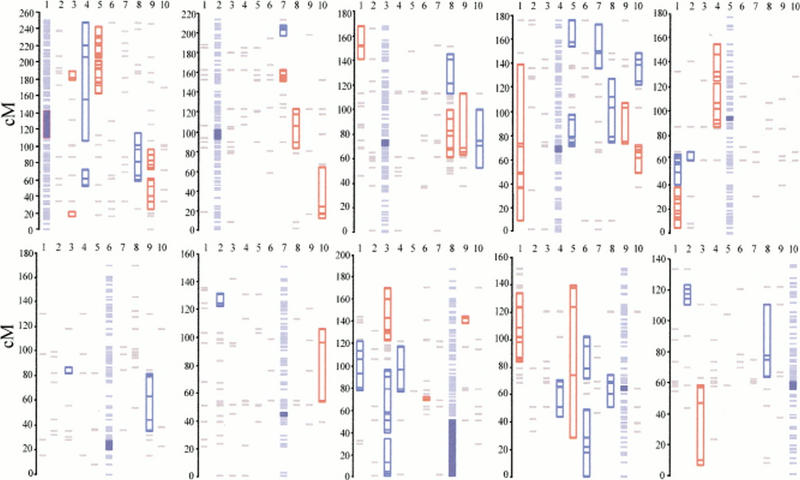
The results of colinearity tests. For each panel, the 10 columns represent the 10 chromosomes. The standard chromosome is shown in light blue, with the centromere in royal blue; the vertical axis represents the centimorgan location on the standard chromosome. Significant colinearities between the standard and tester chromosome are shown on the tester chromosomes in either red (P < 0.005) or dark blue (P < 0.05). (Gray lines) Cross-hybridizing markers that do not comprise significant colinear regions.