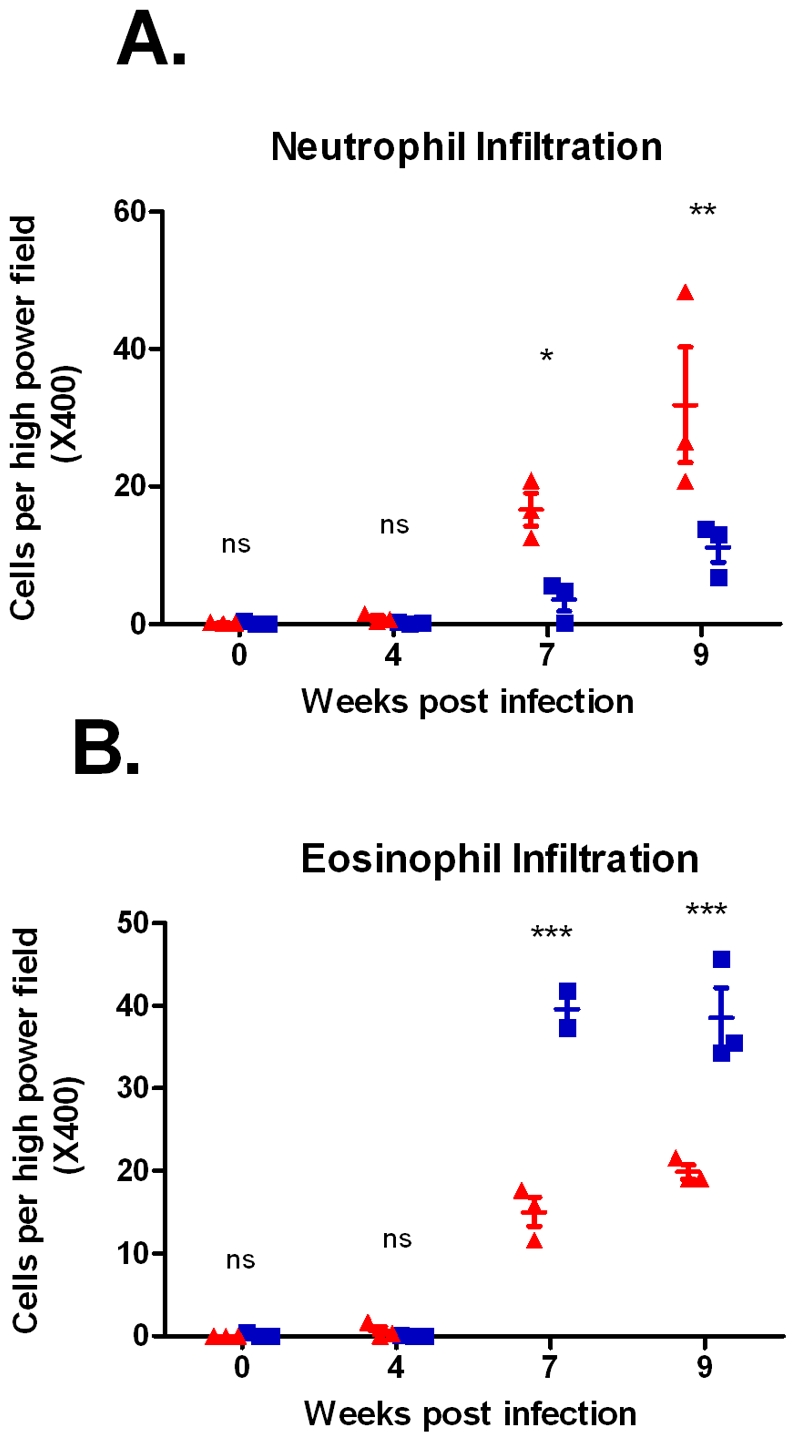
Figure 3. Comparison of cell infiltration in CBA mice and BALB/c mice.

Hepatic neutrophil infiltration (A) was markedly higher in BALB/c mice compared to CBA mice. Conversely, eosinophil numbers (B) were significantly greater in CBA mice compared to BALB/c mice. Statistical significance between strains was determined using 2-Way ANOVA with Bonferroni post hoc tests. ▴ = BALB/c replicates, ▪ = CBA replicates, *** = p<0.001, ** = p<0.01, * = p<0.05, ns = no significant difference. Error bars represent mean with standard error of the mean (SEM).
