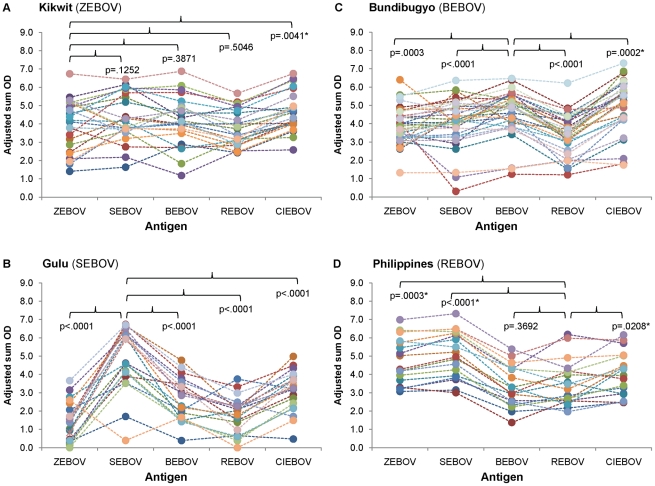
Figure 3. IgG adjusted sum OD values for outbreak samples to each of the five EBOV antigens.
Panels represent samples from Kikwit (A), Gulu (B), Bundibugyo (C), and Philippines (D). Closed circles correspond to the adjusted sum OD value for an individual sample to the specific EBOV antigen. Dotted lines are provided to notate the value of an individual sample across all antigens. Footnote: *Adjusted sum OD value is significantly higher to heterologous antigen than to autologous antigen.

