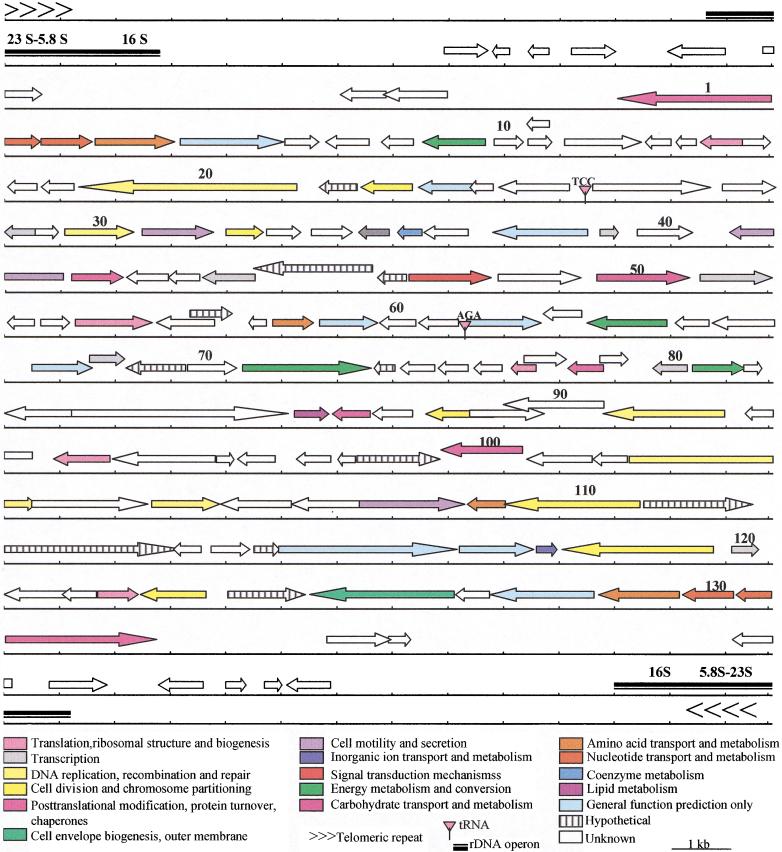
Figure 3.
Putative gene map of Encephalitozoon cuniculi chromosome I. Predicted coding regions are shown with the arrows indicating the transcription orientation; the black box depicts the rDNA transcription unit; the chevrons depict the telomeres. Genes are color coded according to broad role categories as shown in the key.

