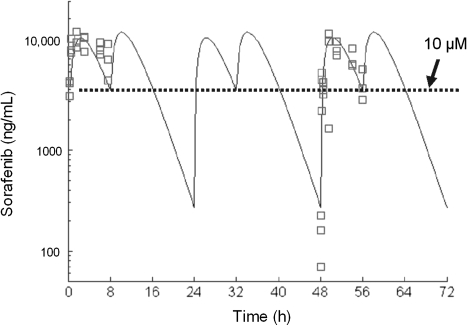
Figure 2.
Sorafenib plasma concentrations in NOD-SCID-IL2Rγnull mice (n = 15) treated with sorafenib (60 mg/kg) twice daily for 3 days. The symbols are the observed concentrations of sorafenib (nanograms per milliliter) at each time point (hours) as measured by high performance liquid chromatography with tandem mass spectrometric detection. The line is the fit of a first-order absorption, one-compartment model to the data.

