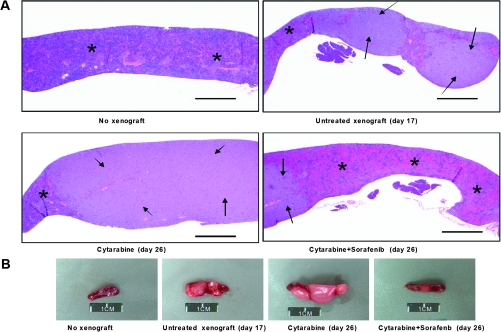
Figure 4.
The effect of cytarabine alone compared with sorafenib plus cytarabine on leukemic cell colonization in the spleen and on spleen size. NOD-SCID-IL2Rγnull mice were injected with luciferase-labeled U937 cells and treated 3 days later with cytarabine (6.25 mg/kg) once daily by intraperitoneal injection, or sorafenib (60 mg/kg) twice daily plus cytarabine (6.25 mg/kg) for 5 days each week for 26 days. A) Representative images of hematoxylin and eosin staining of spleen longitudinal sections from nontumor mice (n = 5), untreated mice (day 17) (n = 3), mice treated with cytarabine alone (day 26) (n = 3), or sorafenib twice daily plus cytarabine (day 26) (n = 3). Images were taken by an Olympus BX41 light microscope (×2 magnification) equipped with a digital camera and Spot Imaging Software. Arrows indicate tumor infiltrate and asterisks indicate normal tissue. Scale bar = 1 mm. B) Pictures of whole spleens from mice in the indicated treatment groups. Data are representative of three mice in each treatment group. Scale bar = 1 cm.

