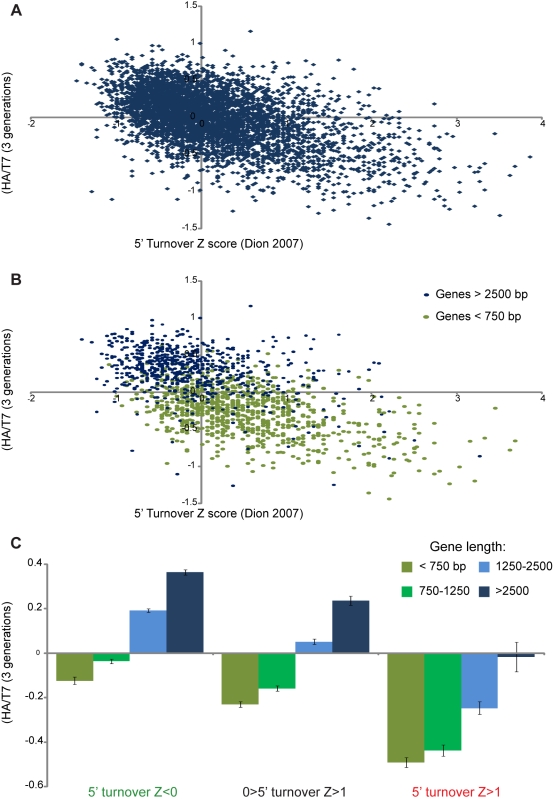
Figure 3. H3 retention anticorrelates with replication-independent turnover in a gene length-dependent manner.
(A) Scatterplot of ancestral H3 retention (median Log2 HA/T7 for the 5′ 1 kb, y-axis) versus replication-independent turnover (Dion et al. [15], Z score, x-axis). (B) HA retention is plotted against 5′ H3 turnover as above but with short and long genes plotted separately. For a given level of H3 turnover, ancestral retention is greater at longer genes. (C) Averages of the 5′ HA/T7 retention parameter (median HA/T7 for the 5′-most 1 kb) are shown for genes broken into different length and 5′ turnover groups. For all turnover levels, longer genes retain more H3-HA than do shorter genes.

