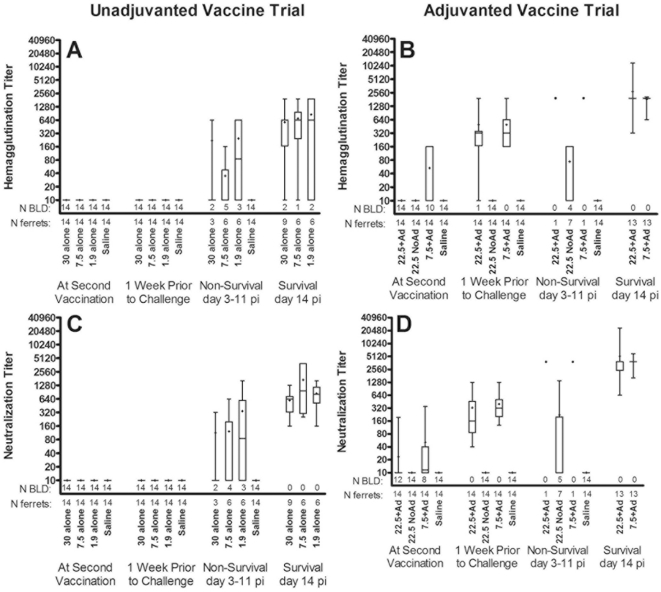
Figure 1. Hemaggutination inhibition and neutralizing antibody titers.
Box plots denote the median (line in box), the 25th and 75th quartile (ends of box), the mean (+), and the 95% confidence intervals (whiskers) with dots representing individual data points. The number (N) of samples analyzed are shown below the x-axis under the number of samples that were below the limit of detection (BLD). At second vaccination is 3 or 4 weeks after initial vaccination and 1 week prior to challenge is either 2 or 3 weeks after second vaccination.

