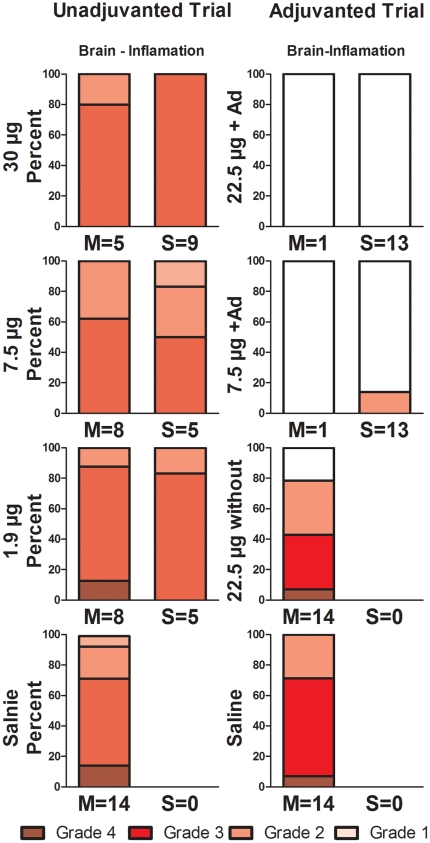
Figure 8. Histopathology grading of brain lesions in survivors and non survivors.
“Brain-Inflamation” represents sections of either olfactory bulb or cerebral tissue with evidence of active and/or resolving inflammation. Tissues from moribund animals are denoted with an “M”, those from survivors (day 14 pi) are denoted with an “S”; the number after the “M” or “S” indicated the number of ferrets in that group. The Y-axis is the percent within each group (M or S) that was scored to each inflammation severity/grade. Grade 4 represents the most inflammation, whereas Grade 1 represents the least inflammation. Grade 0 is clear and represents that no inflammation was found.

