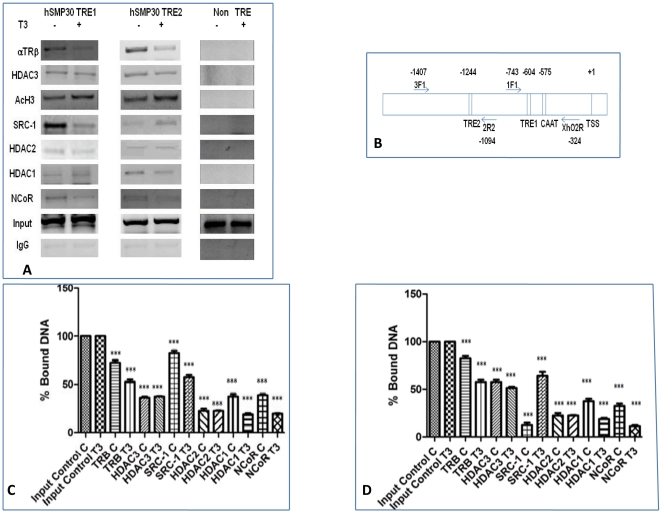
Figure 6. Recruitment of Cofactors to SMP30 promoter after T3 treatment.
(A) Corepressor complex and coactivator binding to minimal SMP30 promoter fragment having TREs and of the control regions having non TREs were analysed by ChIP assays. MCF-7 cells were crosslinked with 1% formaldehyde after 1 hour addition of T3, and ChIP assays were performed according to manufacturer's protocol (Upstate Biotechnology) with some minor modifications. After reverse crosslinking by heating the samples at 65°C for 4–6 hrs and treating with proteinase K, DNA was elute by phenol chloroform extraction then ethanol precipitation. In vivo association of theses protein complexes with the hSMP30 promoter was demonstrated by the amplification of hSMP30 TREs specific DNA fragments from chromatin complexes precipitated by antibodies for TRβ, HDAC3, HDAC2, HDAC1, NCoR, anti-acetyl H3 antibody(H3K18) and SRC-1. Specific primers for detection of respective regions (TRE1, −744 to −324; TRE2, −1407 to −1094; non TRE, −344 to +67) were represented. Similar results were obtained in multiple independent experiments. (B) Diagram of human SMP30 promoter and location of primers in ChIP assays. Two thyroid response elements are located at −604 and −1244 position of hSMP30 gene from transcription start site (TSS). The upstream primer (1F1) for TRE1 started at −743 bp and the downstream primer (Xho2R) started at −324 from TSS of hSMP30 gene. The forward primer (3F1) of TRE2 started at −1407 bp and the reverse primer (2R2) started at −1094 bp from TSS of hSMP30 gene. Primers denoted by arrows and name of each primer are written within a box. CAAT represent the CAAT box. (C, D) Quantitative real-time PCR of ChIP products were carried out by taking same sets of primers as conventional PCR and confirmed that the set of the primers for the real-time PCR yielded a single peak in the 40-cycle procedure. CT values obtained from the real time PCR was used to compare the amplification of bound DNA by different antibodies sample from input control assuming 100% amplification. Values are the mean (mean ± SD) normalized to input levels were compared with those obtained with IgG for at least three independent experiments. ***P<0.0001 difference from control using ANOVA.

