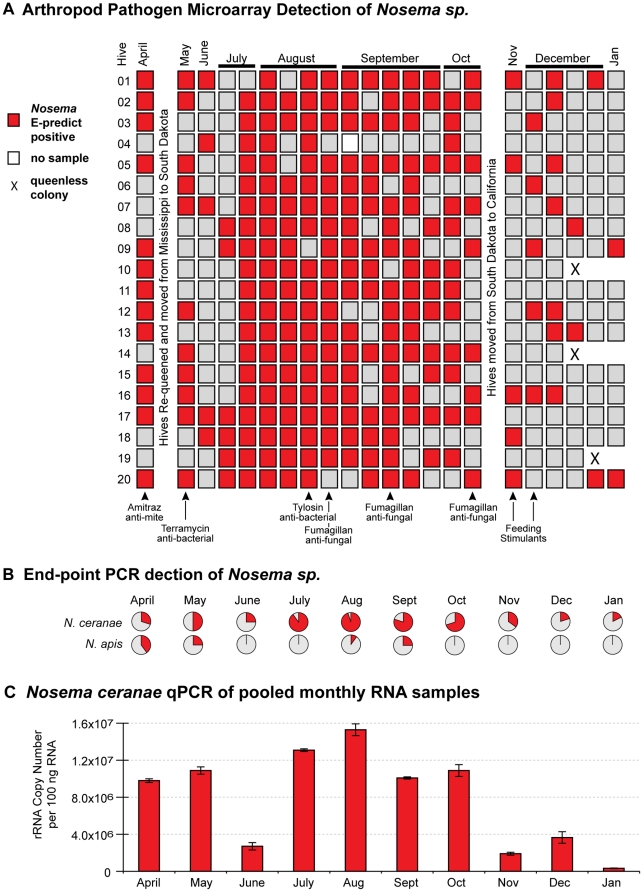
Figure 2. Nosema detection and quantification in time-course samples from 20 honey bee colonies.
(A) Arthropod pathogen microarray detection of Nosema sp. in each colony (5 bees per sample) throughout the 10-month time-course. Colonies were managed using standard commercial beekeeping practices and treatments, which are listed below panel A and further described in Materials and Methods. (B) Nosema ceranae and Nosema apis incidence assessed by species-specific end-point PCR from a single time-point (n = 20) each month; the positive sample percentages in each pie-chart are indicated in red. (C) Relative abundance of Nosema ceranae throughout the time-course assessed by qPCR of pooled monthly RNA samples; quantification of rRNA copy number based on a standard curve as described in Materials and Methods.

