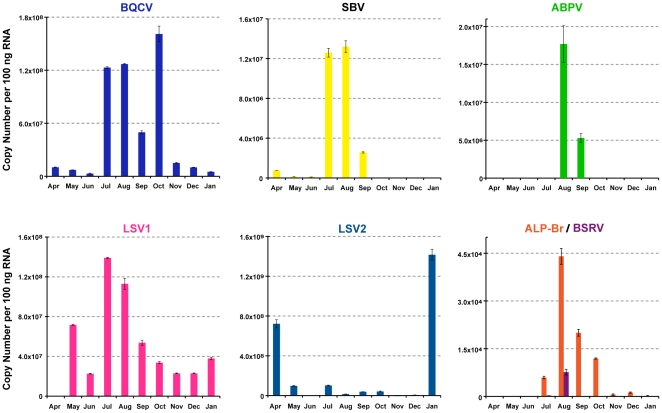
Figure 4. Relative abundance of select viruses assessed by RT-qPCR of pooled monthly time-course samples.
Viral genome copy numbers per 100 ng RNA were calculated based on standard curves [(black queen cell virus (BQCV), sacbrood virus (SBV), acute bee paralysis virus (ABPV), Lake Sinai virus strain 1 (LSV1), Lake Sinai virus strain 2 (LSV2), aphid lethal paralysis virus strain Brookings (ALP-Br), and Big Sioux River virus (BSRV)]; multiplying reported values by 500 provides a copy number per bee estimate, as further described in Materials and Methods. LSV2, a novel virus, reached the highest copy number observed in this study in January 2010 (1.42×10⁹ copies per 100 ng of RNA sample; approximately 7.1×10¹¹ copies per bee); note the y-axes on each graph are independently scaled.

