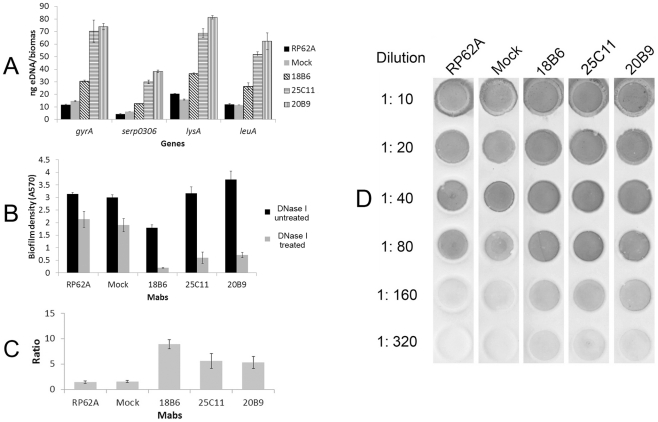
Figure 8. EPS biosynthesis in biofilm of S. epidermidis.
(A) Extracellular DNA quantification. Extracellular DNA was isolated from the biofilm matrices of S. epidermidis RP62A, and Q-PCRs of four chromosomal loci (gyrA (gyrase A), serp0306 (ferrichrome transport ATP-binding protein A), lysA (diaminopimelate decarboxylase A), and leuA (2-isopropylmalate synthase)) were performed for eDNA quantification in each biofilm. The biomass that represented the biofilm density was quantified at A600, and the eDNA measurement was normalized to biofilm biomass as described previously [27]. Data are depicted as averages of three Q-PCR detections with the standard deviation, and the results represent one of three independent experiments. (B, C) Biofilm stability against DNase treatment. When exposed to DNase I (0.14 U/µL), the biofilm was more severely disintegrated in the presence of each MAb compared with that formed in the absence of the MAbs. The data are means ± SD of three independent experiments. The biofilm density ratios of the untreated biofilms and biofilms treated with DNase I were plotted (C). (D) PIA synthesis in biofilm of S. epidermidis. PIA synthesis in biofilm of S. epidermidis RP62A was detected using the WGA-HRP dot blot assay. Serial dilutions of the PIA extractions from biofilm bacteria were spotted onto nitrocellulose transfer membranes, and the HRP activity was visualized using chromogenic detection. The data represent one of three independent experiments. “RP62A”: untreated; “Mock”: normal mouse IgG-treated.

