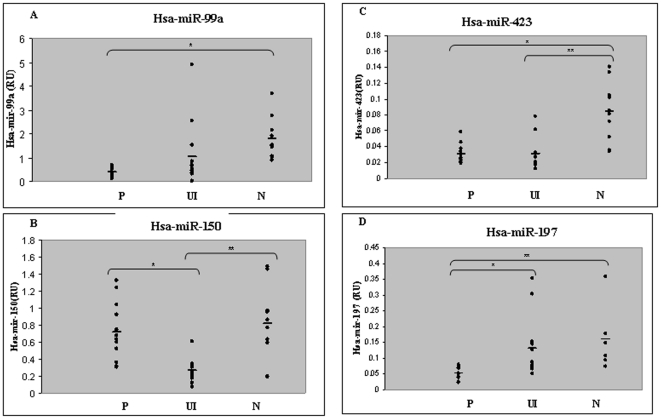
Figure 2. Quantification of miRNAs expression by qRT-PCR.
The levels of hsa-miR-99a (A), hsa-miR-150 (B), hsa-miR-423 (C) and hsa-miR-197 (D) in normal skin (N, n = 10), psoriatic lesional skin (P, n = 16), and psoriatic uninvolved skin (UI, n = 16) were quantified by qPCR, and normalized to Rnu48. Each dot represents one sample. The average is denoted by the horizontal line. (A) Hsa-miR-99a (*p<0.0001 using un-paired t-test). (B) Hsa-miR-150 (*p<0.0007 using paired t-test, **p<0.0004 using un-paired t-test). (C) Hsa- miR-423 (*p<0.0001, **p<0.0003 using un-paired t-test). (D) Hsa-miR-197(**p<0.009 **p<0.0019 using un-paired t-test).

