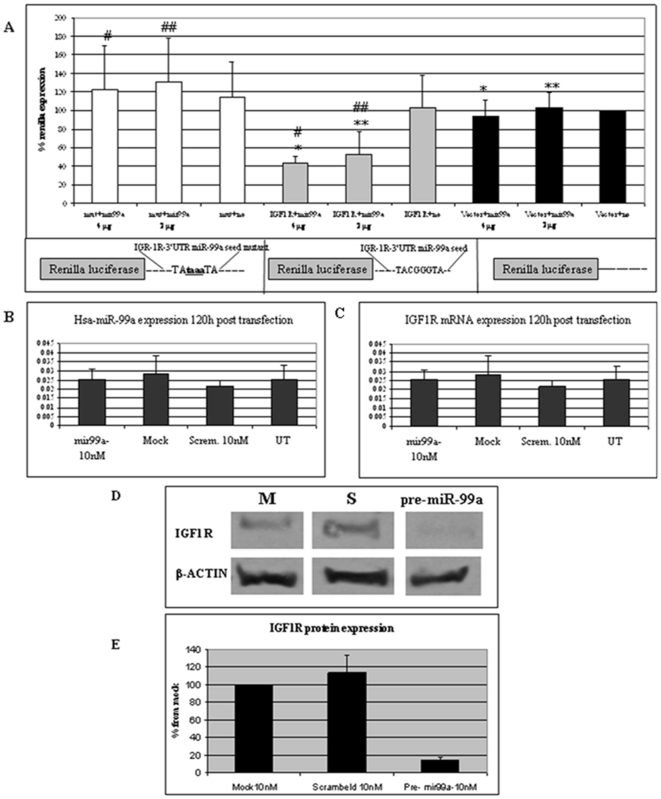
Figure 5. 3′ UTR of IGF-1R is a target of hsa-miR-99a seed sequence.
(A) 293T cells were transfected with psi-CHECK2 vectors encoding luciferase (right panel), luciferase fused to the IGF-1R 3′UTR (middle panel), or luciferase fused to a mutated IGF-1R 3′UTR (left panel) together with increasing amounts of an hsa-miR-99a expression plasmid as indicated. A scheme of the reporter vectors is shown under each panel. Luciferase activity was assessed 72 h later, and is depicted relative to that of the control cells transfected with psi-CHECK2 alone (given a value of 100%). Results represent the mean of triplicates. # p<0.0071, # # p<0.0047, * p<0.0075, ** p<0.0007. (B–C) PHK cells were transfected with 10 nM pre-miR-99a, a scrambled sequence, mock transfected or left untransfected. RNA was extracted 120 h later, and the level of hsa-miR-99a (B) and IGF-1R mRNA (C) was quantified by qPCR. Results represent the means of triplicates. Error bars, SD. (D) PHK cells were either mock-transfected or transfected with 10 nM pre-miR-99a, or a scrambled sequence. Cells were processed for Western blotting 120 h later to detect the level of IGF-1R protein. β-actin was used as the loading control. (E). The level of IGF-1R was quantified from the Western blot described in (D) by densitometry (EZQuant-Gel). Results represent the means of triplicate Western blots. Error bars, SD.

