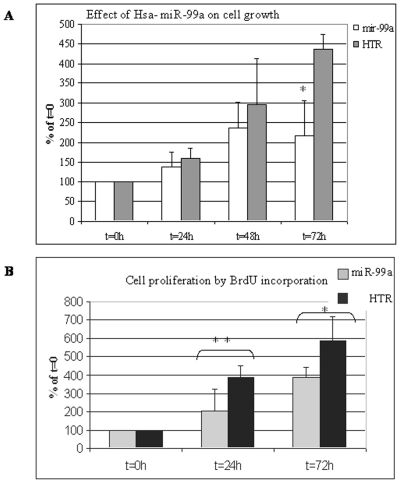
Figure 6. Hsa-miR-99a effect on keratinocytes cell growth.
Proliferation of HaCaT cells stably expressing hsa-miR-99a or the HTR control RNA was assessed by MTT (A) and BrdU incorporation (B) assays. Proliferation was calculated as the percentage of the reading at seeding time (t = 0) given a value of 100%. Mean and standard deviation were calculated from 3 independent experiments. *P = 0.0037 in (A) and *P<0.0211**P<0.0420 in (B).

