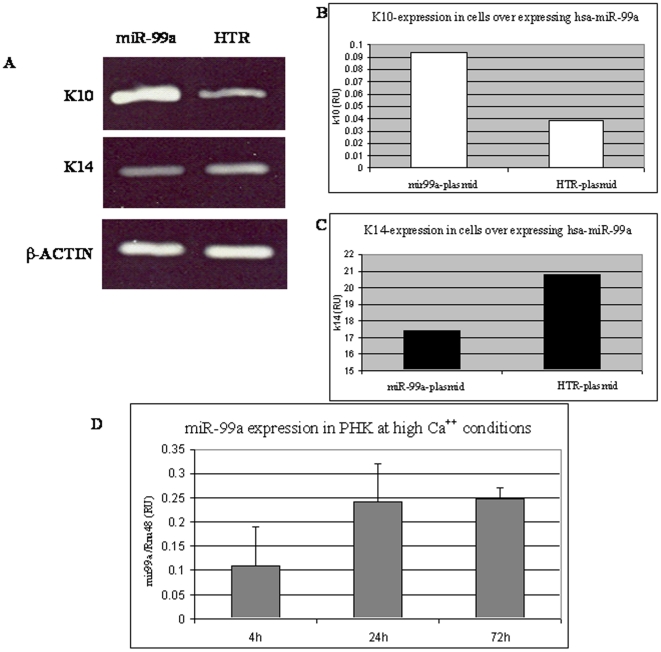
Figure 7. Hsa-miR-99a effect on differentiation of keratinocytes.
(A–C) The levels of K10 and K14 differentiation markers were assessed in HaCaT cells stably expressing hsa-miR-99a or the HTR control RNA by RT-PCR (A) and qPCR (B–C) analysis. (D) PHK cells were seeded in high, 1.5 mM Ca++ medium. Cells were harvested at the indicated time points and the level of endogenous miR-99a was determined by qPCR.

