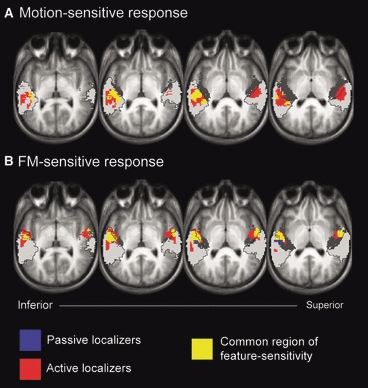
Fig. 2.

Auditory cortical responses to (A) spatial motion and (B) FM. All clusters survived correction for multiple comparisons (P < 0.05). Blue: localizer contrast with passive listening conditions [i.e. A, p(Mo + FM) > p(Stat + FM); B, p(Mo + FM) > p(Mo + nonFM)]. Red: localizer contrast with active listening conditions [i.e. A, aFM(Mo + FM) > aFM(Stat + FM); B, aMo(Mo + FM) > aMo(Mo + nonFM)]. Yellow: overlap between the two contrasts. Activity is overlaid onto the mean normalized anatomical scan for the group. Three oblique axial views are shown. These have been spaced at 3-mm intervals and angled across the supratemporal plane to best illustrate the spatial arrangement of activity with respect to key anatomical sites. The location of Heschl's gyrus (primary auditory cortex) is indicated by the underlying dark grey shading, and the location of the planum temporale and planum polare (non-primary auditory cortex) is indicated by the underlying light grey shading.
