Fig. 1.

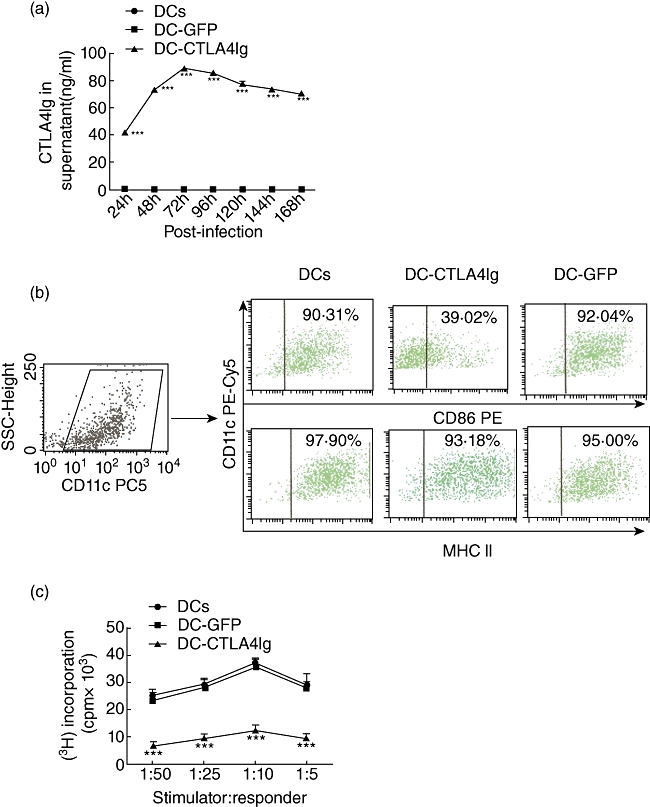
(a) Level of cytotoxic T lymphocyte antigen 4 immunoglobulin (CTLA4Ig) in the supernatant of dendritic cell (DC) cultures at various times after gene transfection. Results were presented as mean ± 1 standard deviation (s.d.) (n = 3), ***P < 0·001, compared with the DCs group. (b) Representative fluorescence activated cell sorter (FACS) dot-plots showing level of CD86 and major histocompatbility complex (MHC) class II expressed on DCs with CD11c. The DC-CTLA4Ig group showed lower expression of CD86, compared with DCs and DC-green fluorescent protein (GFP) surface (39·02% versus 92·04% and 90·31%). (c) Counts per minute (cpm) from triplicate mixed lymphocyte reaction cultures showing the capacity for allogeneic T cell stimulation of three DC groups. Data were presented as mean ± s.d. (n = 3), ***P < 0·001, compared with the DC group.
