Figure 5.
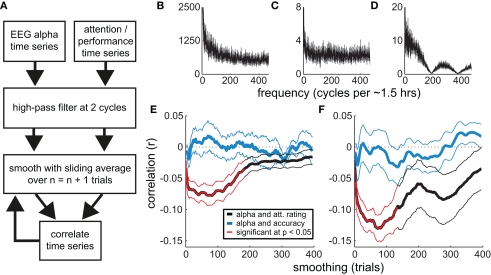
Correlations between attentional state ratings, prestimulus EEG alpha power, and task performance (detection accuracy). (A) Flow chart illustrating the smoothing analysis. (B–D) Grand average Fourier power spectra of the trial-by-trial time series of attentional state ratings, prestimulus EEG alpha power, and detection task accuracy, respectively. The SE of the mean is shown in gray. (E,F) Grand average correlations (r) as a function of the degree of smoothing (sliding window size). The correlations between the time series of attentional state ratings and prestimulus EEG alpha power are shown in black. The correlations between the time series of detection task accuracy and prestimulus EEG alpha power are shown in blue. Significant correlations are highlighted in red. Thin lines show the SE of the mean. In (E), smoothing is applied to the time series of attentional state ratings and detection task accuracy; in (F), smoothing is applied to the time series of prestimulus EEG alpha power.

