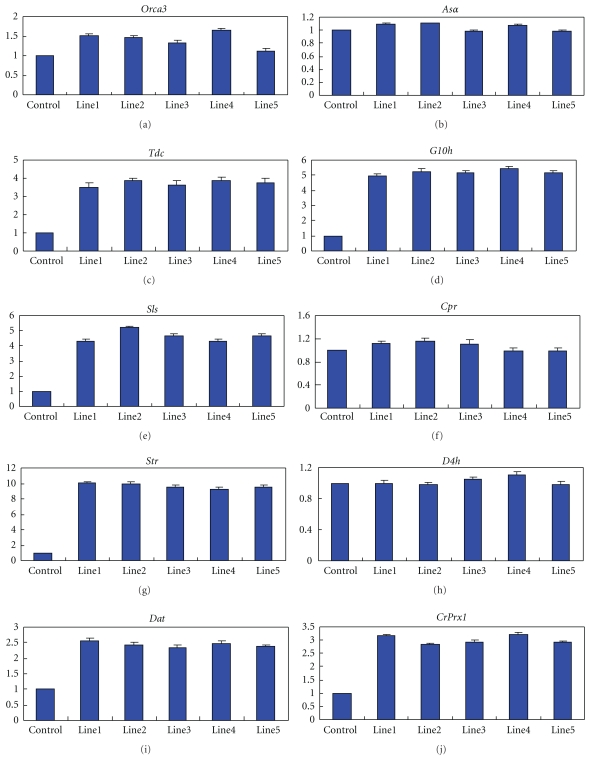
Figure 5.
Quantitative real-time PCR analysis for the expression of ten genes in five tetraploid lines and three diploid lines which were also treated with colchicine solution in C. roseus. The average value relative expression of the controls was set to 1 level. The genes analyzed are Orca3 (a), Asα (b), Tdc (c), G10h (d), Sls (e), Cpr (f), Str (g), D4h (h), Dat (i), and CrPrx1 (j). The data of each line represented is average value of three replicates in each experiment, while the data of control represented is average value of three independent control plants with three replicates in each experiment.

