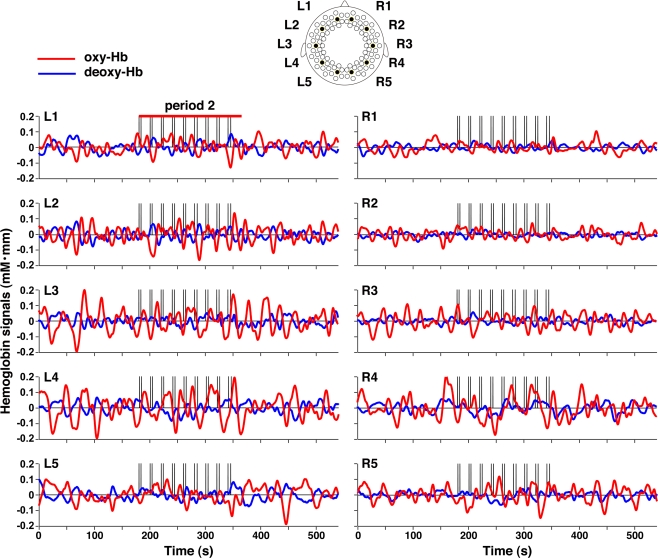
Figure 2.
Representative signal changes in the three periods. The oxy-Hb and deoxy-Hb signal changes in five channels in each hemisphere were plotted. The red and blue lines indicate oxy- and deoxy-Hb signals, respectively. The vertical lines in period 2 indicate the onset and offset of the stimulus presentation.

