Figure 4.
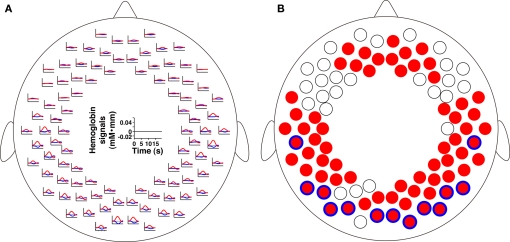
The signal changes in all measurement channels during period 2. (A) The averaged time courses. The red and blue lines indicate oxy-Hb and deoxy-Hb signals, respectively. The 0 baseline was set at the mean value elicited for each measurement channel around the stimulus onset (see Materials and Methods). (B) The statistical map of the oxy-Hb signal increases and deoxy-Hb signal decreases in period 2. The red filled circles indicate measurement channels that showed significant oxy-Hb signal changes (p < 0.05, FDR corrected). The blue open circles over the red circles indicate measurement channels that showed deoxy-Hb signal changes (p < 0.05, FDR corrected).

